// 添加上下文属性到 Record 中,然后调用底层的 handler func(h ContextHandler) Handle(ctx context.Context, r slog.Record) error { if attrs, ok := ctx.Value(slogFields).([]slog.Attr); ok { for _, v := range attrs { r.AddAttrs(v) } }
return h.Handler.Handle(ctx, r) }
// AppendCtx 将 slog 属性添加到提供的上下文中, // 以便在使用此类上下文创建的任何 Record 中都会包含该属性 funcAppendCtx(parent context.Context, attr slog.Attr) context.Context { if parent == nil { parent = context.Background() }
if v, ok := parent.Value(slogFields).([]slog.Attr); ok { v = append(v, attr) return context.WithValue(parent, slogFields, v) }
v := []slog.Attr{} v = append(v, attr) return context.WithValue(parent, slogFields, v) }
该 ContextHandler 结构嵌入了 slog.Handler
接口,并实现了 Handle 方法,以提取存储在提供的上下文中的
Slog 属性。如果找到,它们将被添加到 Record
中,然后调用底层的 Handler 来格式化和输出记录。
for i, v := range frames { f := stackFrame{ Source: filepath.Join( filepath.Base(filepath.Dir(v.File)), filepath.Base(v.File), ), Func: filepath.Base(v.Function), Line: v.Line, }
// User 没有实现 `LogValuer` 接口 type User struct { ID string`json:"id"` FirstName string`json:"first_name"` LastName string`json:"last_name"` Email string`json:"email"` Password string`json:"password"` }
for i := 1; i <= 10; i++ { logger.Info(fmt.Sprintf("a message from the gods: %d", i)) } }
输出:
1 2
{"time":"2023-10-18T19:14:09.820090798+02:00","level":"INFO","msg":"a message from the gods: 4"} {"time":"2023-10-18T19:14:09.820117844+02:00","level":"INFO","msg":"a message from the gods: 5"}
sugar.Info("Hello from Zap logger!") sugar.Infoln( "Hello from Zap logger!", ) sugar.Infof( "Hello from Zap logger! The time is %s", time.Now().Format("03:04 AM"), )
{"level":"info","ts":1684147807.960761,"caller":"zap/main.go:17","msg":"Hello from Zap logger!"} {"level":"info","ts":1684147807.960845,"caller":"zap/main.go:18","msg":"Hello from Zap logger!"} {"level":"info","ts":1684147807.960909,"caller":"zap/main.go:21","msg":"Hello from Zap logger! The time is 11:50 AM"} {"level":"info","ts":1684148355.2692218,"caller":"zap/main.go:25","msg":"User logged in","username":"johndoe","userid":123456,"provider":"google"}
logger.Warn("User account is nearing the storage limit", zap.String("username", "john.doe"), zap.Float64("storageUsed", 4.5), zap.Float64("storageLimit", 5.0), )
1
{"level":"warn","ts":1684166023.952419,"caller":"zap/main.go:46","msg":"User account is nearing the storage limit","username":"john.doe","storageUsed":4.5,"storageLimit":5}
childLogger.Info("redirecting user to admin dashboard") }
注意两个日志中都存在 service 和
requestID
1 2
{"level":"info","ts":1684164941.7644951,"caller":"zap/main.go:52","msg":"user registration successful","service":"userService","requestID":"abc123","username":"john.doe","email":"john@example.com"} {"level":"info","ts":1684164941.764551,"caller":"zap/main.go:57","msg":"redirecting user to admin dashboard","service":"userService","requestID":"abc123"}
您可以使用相同的方法向所有日志添加全局元数据。例如,您可以像这样做,将程序的进程ID和编译程序所使用的
Go 版本包含在所有记录中:
logger.Error("Failed to perform an operation", zap.String("operation", "someOperation"), zap.Error(errors.New("something happened")), // the key will be `error` here zap.Int("retryAttempts", 3), zap.String("user", "john.doe"), )
输出:
1
{"level":"error","ts":1684164638.0570025,"caller":"zap/main.go:47","msg":"Failed to perform an operation","operation":"someOperation","error":"something happened","retryAttempts":3,"user":"john.doe","stacktrace":"main.main\n\t/home/ayo/dev/demo/zap/main.go:47\nruntime.main\n\t/usr/local/go/src/runtime/proc.go:250"}
{"level":"fatal","ts":1684170760.2103574,"caller":"zap/main.go:47","msg":"Something went terribly wrong","context":"main","code":500,"error":"An error occurred","stacktrace":"main.main\n\t/home/ayo/dev/demo/zap/main.go:47\nruntime.main\n\t/usr/local/go/src/runtime/proc.go:250"} exit status 1
for i := 1; i <= 10; i++ { logger.Info("an info message") logger.Warn("a warning") } }
因此,您应该只看到六个日志条目,而不是观察 20 个。
1 2 3 4 5 6
{"level":"info","timestamp":"2023-05-17T16:00:17.611+0100","msg":"an info message"} {"level":"warn","timestamp":"2023-05-17T16:00:17.611+0100","msg":"a warning"} {"level":"info","timestamp":"2023-05-17T16:00:17.611+0100","msg":"an info message"} {"level":"warn","timestamp":"2023-05-17T16:00:17.611+0100","msg":"a warning"} {"level":"info","timestamp":"2023-05-17T16:00:17.611+0100","msg":"an info message"} {"level":"warn","timestamp":"2023-05-17T16:00:17.611+0100","msg":"a warning"}
type SensitiveFieldEncoder struct { zapcore.Encoder cfg zapcore.EncoderConfig }
// EncodeEntry is called for every log line to be emitted so it needs to be // as efficient as possible so that you don't negate the speed/memory advantages // of Zap func(e *SensitiveFieldEncoder) EncodeEntry( entry zapcore.Entry, fields []zapcore.Field, ) (*buffer.Buffer, error) { filtered := make([]zapcore.Field, 0, len(fields))
for _, field := range fields { user, ok := field.Interface.(User) if ok { user.Email = "[REDACTED]" field.Interface = user }
{"level":"info","timestamp":"2023-05-20T09:14:46.043+0100","msg":"an info log","name":"main","user":{"id":"USR-12345","name":"John Doe","email":"john.doe@example.com"}}
{"level":"info","timestamp":"2023-05-20T09:28:31.231+0100","msg":"an info log","name":"main","user":{"id":"USR-12345","name":"John Doe","email":"[REDACTED]"}}
然而,请注意,自定义编码器不会影响使用 With()
方法附加的字段,因此如果您这样做:
1 2
child := logger.With(zap.String("name", "main"), zap.Any("user", u)) child.Info("an info log")
{"level":"info","timestamp":"2023-05-20T09:31:11.919+0100","msg":"an info log","name":"main","user":{"id":"USR-12345","name":"John Doe","email":"john.doe@example.com"}}
将 Zap 用作 Slog 的后端
Go 语言引入了新的结构化日志包Slog后,开始着手在 Zap 中实现
slog.Handler 接口,以便利用 Slog API 与
Zap 后端。这种集成确保了在各种依赖项中日志 API
的一致性,并便于无需大幅更改代码即可无缝切换日志包。
目前为止,Slog 尚未包含在官方的 Go
发布版本中。因此,Zap 与 Slog
的官方集成已经提供在一个单独的模块中,可以使用以下命令进行安装:
上述代码片段仅输出比 INFO
更高级别的日志。您还可以通过环境变量设置最小级别(在本教程后面部分演示)。
将上下文数据添加到日志中
当你调用与所选日志级别相对应的方法(Info()、Debug()等)时,将返回一个
zerolog.Event 类型,该类型代表一个日志事件。这个
Event
类型提供了几个方法,允许你向其上下文添加属性(以键值对的形式),以便日志条目包含足够的上下文数据,帮助你理解事件。例如,当记录在服务器上创建资源时,你可以在日志中包含用户
ID 或客户端信息(如 IP 地址),这样以后通过这些属性轻松过滤日志。
for i := 1; i <= 10; i++ { log.Info().Msgf("a message from the gods: %d", i) } }
在此示例中,配置为每条日志在五次中仅记录一次。这在 for
循环中进行了演示,其中 INFO
消息通常被记录十次,但由于采样,它只被记录两次:
1 2
{"level":"info","time":"2023-09-02T08:05:48+01:00","message":"a message from the gods: 1"} {"level":"info","time":"2023-09-02T08:05:48+01:00","message":"a message from the gods: 6"}
warnSampler := &zerolog.BurstSampler{ Burst: 3, Period: 1 * time.Second, // Log every 5th message after exceeding the burst rate of 3 messages per // second NextSampler: &zerolog.BasicSampler{N: 5}, }
{"level":"error","stack":[{"func":"main","line":"19","source":"main.go"},{"func":"main","line":"250","source":"proc.go"},{"func":"goexit","line":"1594","source":"asm_amd64.s"}],"error":"file open failed!","time":"2023-08-24T21:52:24+01:00","message":"something happened!"}
err := errors.New("failed to connect to database") logger.Fatal().Err(err).Msg("something catastrophic happened!")
输出:
1 2
{"level":"fatal","error":"failed to connect to database","time":"2023-09-01T09:34:49+01:00","message":"something catastrophic happened!"} exit status 1
funcmain() { // 创建一个保存 CPU 分析结果的文件 f, err := os.Create("profile.prof") if err != nil { panic(err) } defer f.Close()
// 开始采集 CPU 性能指标 if err := pprof.StartCPUProfile(f); err != nil { panic(err) } defer pprof.StopCPUProfile()
// 模拟耗 CPU 的操作 for i := 0; i < 1000000; i++ { n := rand.Intn(100) _ = square(n) } }
funcsquare(n int)int { return n * n }
在上面的代码中:
main 函数生成一个介于 1 和 1000
之间的随机数,然后计算其平方根。
pprof.StartCPUProfile(f) 函数启动 CPU
分析,从而创建可以在以后分析的 profile 文件。
defer pprof.StopCPUProfile() 语句确保在程序结束时停止
CPU 分析,无论程序是正常终止还是由于错误。
我们调用 rand.Intn(100) 1000000 次来模拟 CPU
密集型任务。
接下来,我们执行这个程序:
1
go run main.go
程序运行结束后,会生成一个名为 profile.pprof
的文件,这个文件包含了 CPU 分析的数据。我们可以使用
go tool pprof 命令来分析这个文件:
1
go tool pprof profile.prof
接下来,会输出如下内容,并进入了一个交互式的命令行:
1 2 3 4 5
Type: cpu Time: Jan 15, 2024 at 5:17pm (CST) Duration: 205.21ms, Total samples = 10ms ( 4.87%) Entering interactive mode (type "help" for commands, "o" for options) (pprof)
我们可以接着输入一些命令,来查看 profile 的数据:
比如,我们可以输入 top 来查看最耗 CPU 的函数:
1 2 3 4 5 6 7 8
(pprof) top Showing nodes accounting for 10ms, 100% of 10ms total flat flat% sum% cum cum% 10ms 100% 100% 10ms 100% math/rand.(*Rand).Intn 0 0% 100% 10ms 100% main.main 0 0% 100% 10ms 100% math/rand.Intn (inline) 0 0% 100% 10ms 100% runtime.main (pprof)
在第一个示例中,我们了解了如何使用 pprof 工具创建 CPU
分析文件并对其进行分析。输出显示每个函数的调用次数,以及执行每个函数所花费的总时间。这使我们能够识别消耗最多
CPU
时间的函数,并可能对其进行优化。在第二个示例中,输出显示了每个函数的内存使用情况,包括分配的数量和分配的字节数。这使我们能够识别使用过多内存的函数,并可能对其进行优化以减少内存使用。
此外,优化算法和数据结构可以显著提高性能。通过选择更有效的算法和数据结构,可以减少完成操作所需的
CPU 时间,并提高整体程序性能。
总结
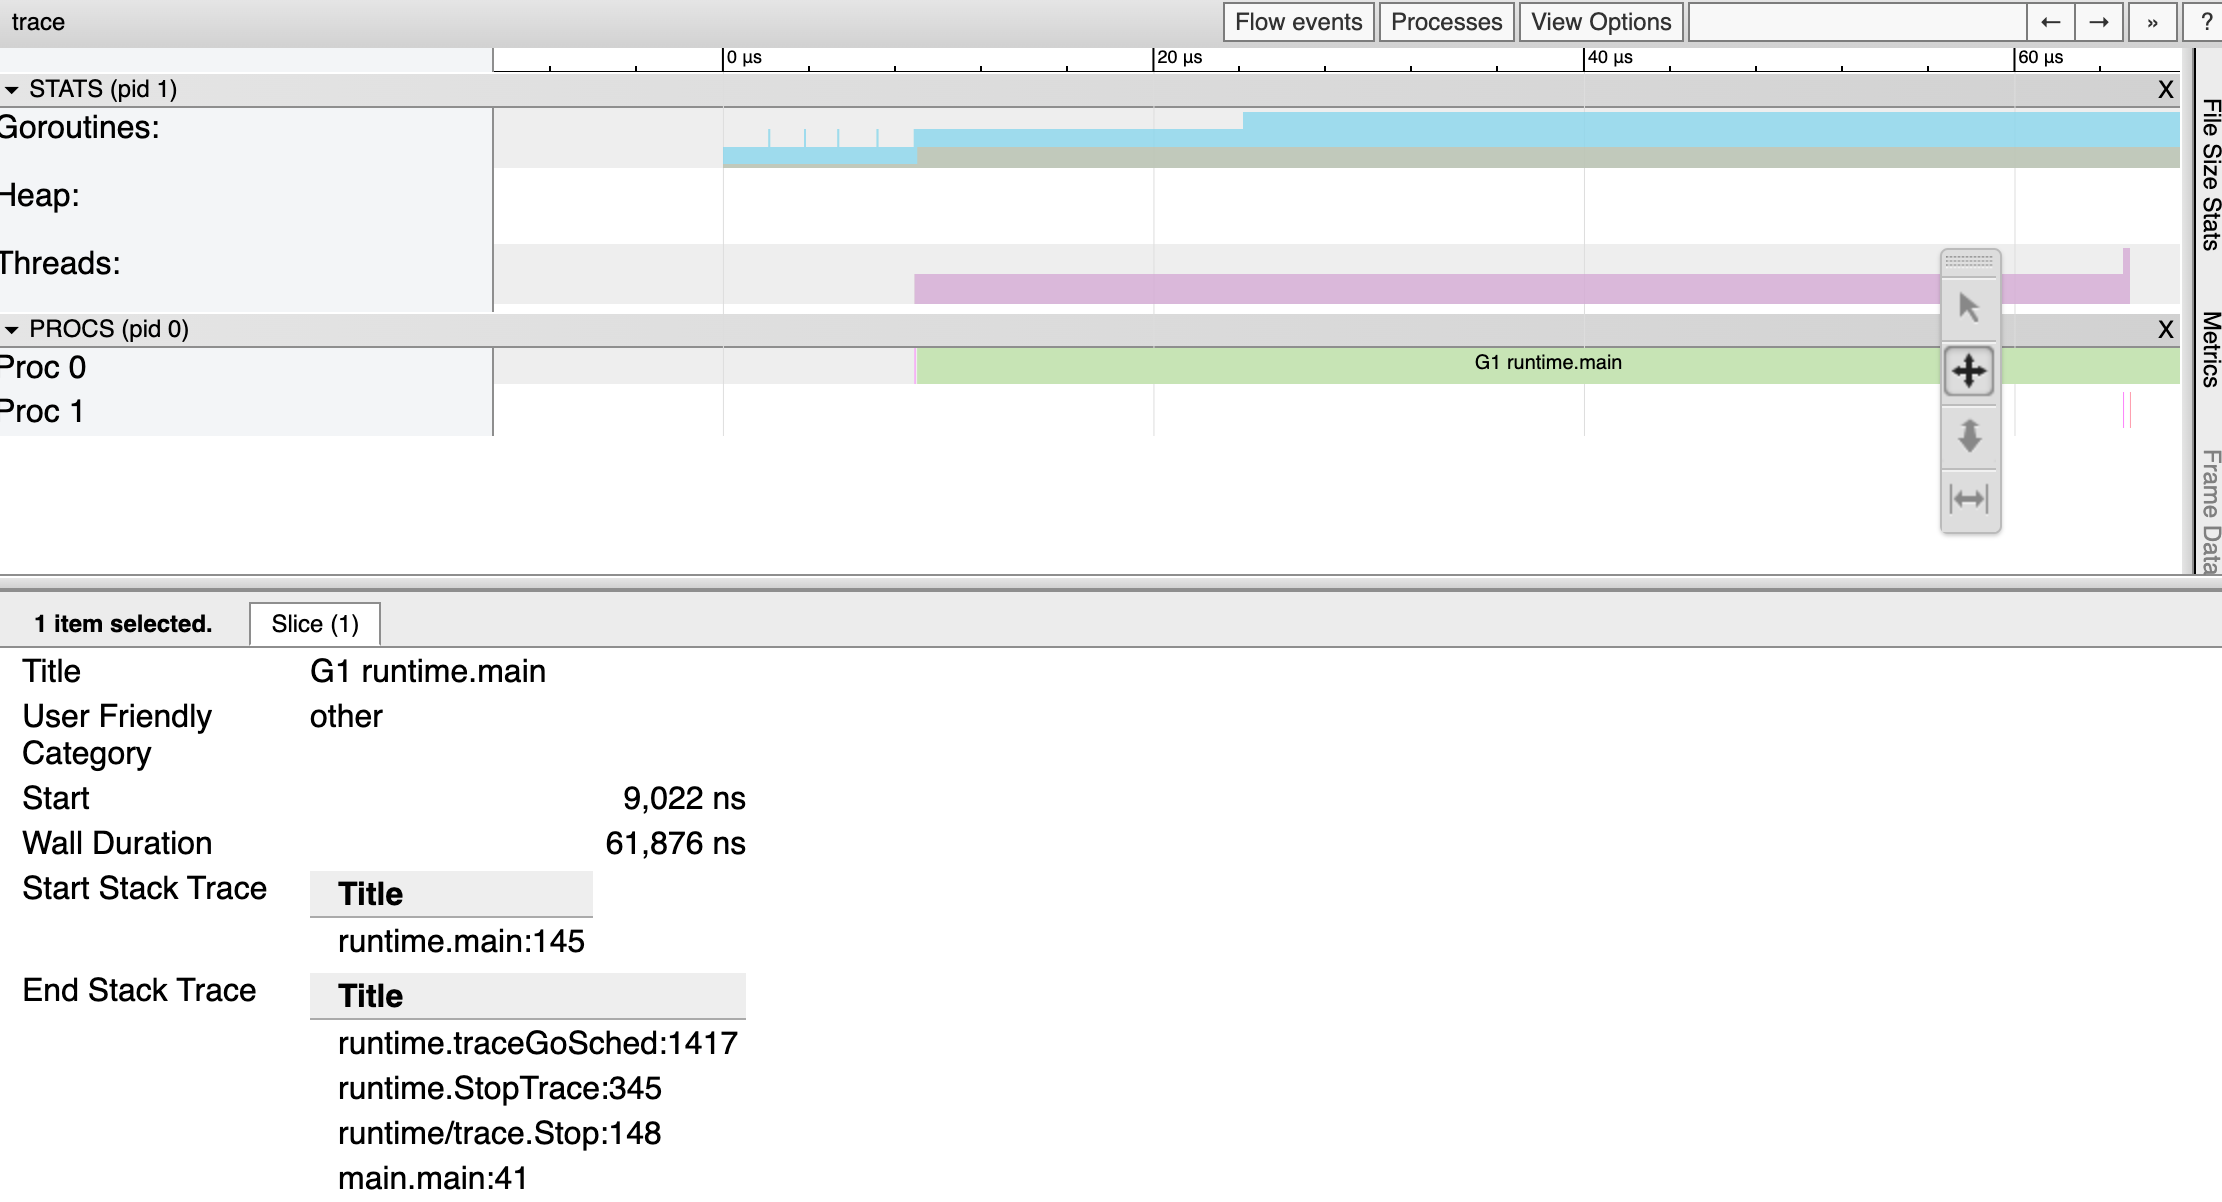
优化 Go
应用程序中的性能以确保它们高效且有效地运行非常重要。通过这样做,我们可以改善用户体验,降低运行应用程序的成本,并提高代码的整体质量。我们可以使用
pprof 和 trace 工具来分析 CPU
和内存使用情况,并识别 Go
应用程序中的瓶颈和其他问题。然后,我们可以根据这些工具的输出对代码进行有针对性的改进,例如减少内存分配、最小化阻塞操作和优化算法。分析工具(如
pprof 和 trace
)对于识别和解决性能问题至关重要。
基本在所有的编程语言中,都有 map 这种数据结构,Go
语言也不例外。 我们知道 Go 是一门对并发支持得比较好的语言,但是
map 并不支持并发读写。 比如,下面这种写法是错误的:
1 2 3 4 5 6 7 8 9 10 11 12 13 14 15 16 17
var m = make(map[int]int) var wg sync.WaitGroup wg.Add(2) // 启动两个协程序同时写入 map gofunc() { for i := 0; i < 100; i++ { m[i] = i } wg.Done() }() gofunc() { for i := 0; i < 100; i++ { m[i] = i } wg.Done() }() wg.Wait()
这样写会报错:
1
fatal error: concurrent map writes
为什么 Go map 不支持并发读写
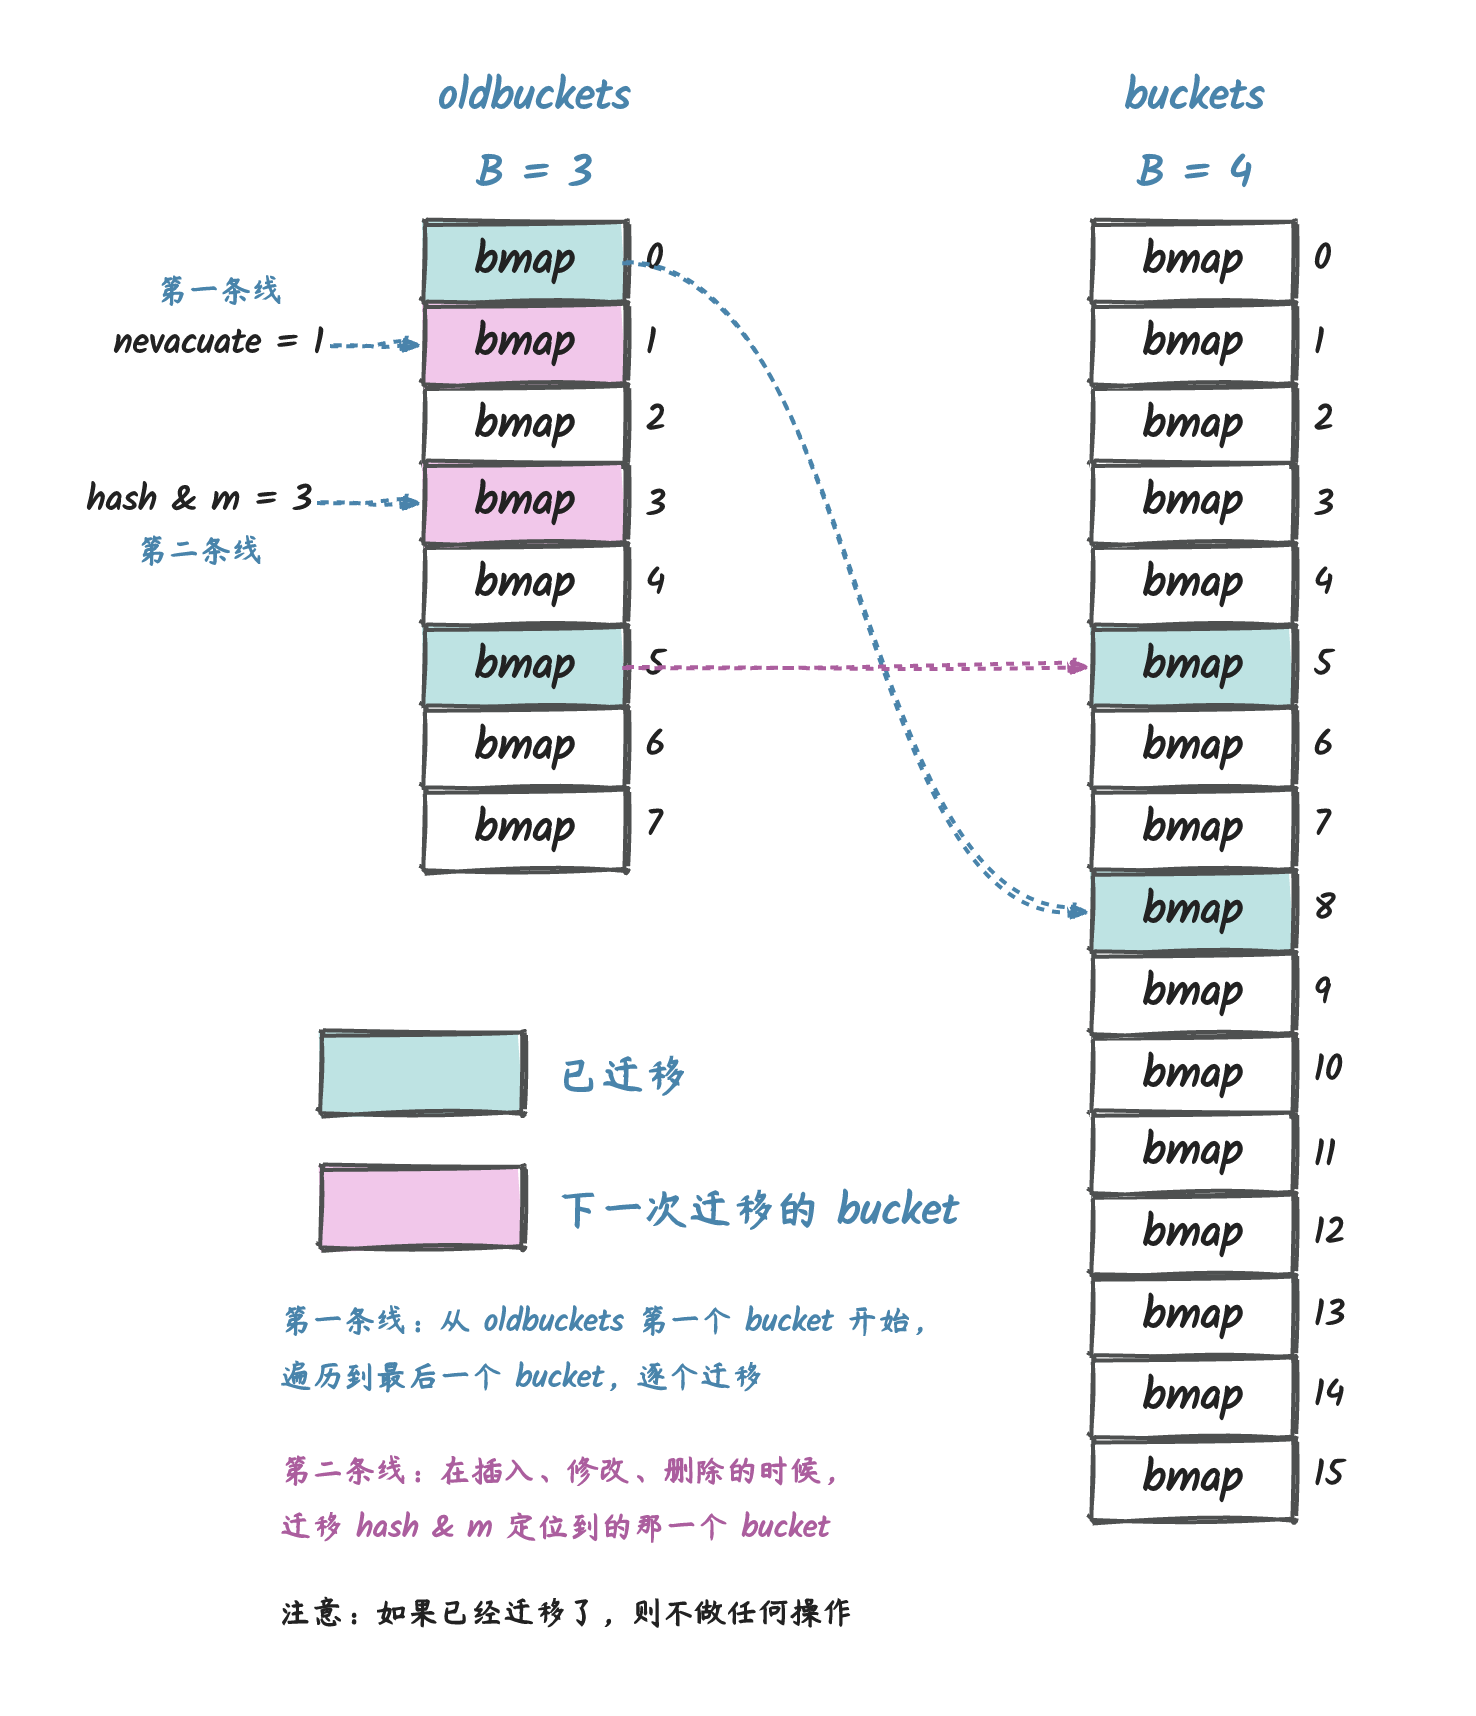
这跟 map 的实现有关,根本原因是:map
的底层是支持自动扩容的,在添加元素的时候,如果发现容量不够,就会自动扩容。
如果允许扩容和访问操作同时发生,那么访问到的数据就不一定就是我们之前存放进去的了,所以
Go 从设计上就禁止了这种操作。 也就是 fail fast 的原则。
var m sync.Map var wg sync.WaitGroup wg.Add(2) gofunc() { for i := 0; i < 100; i++ { m.Store(i, i) } wg.Done() }() gofunc() { for i := 0; i < 100; i++ { m.Store(i, i) } wg.Done() }() wg.Wait()
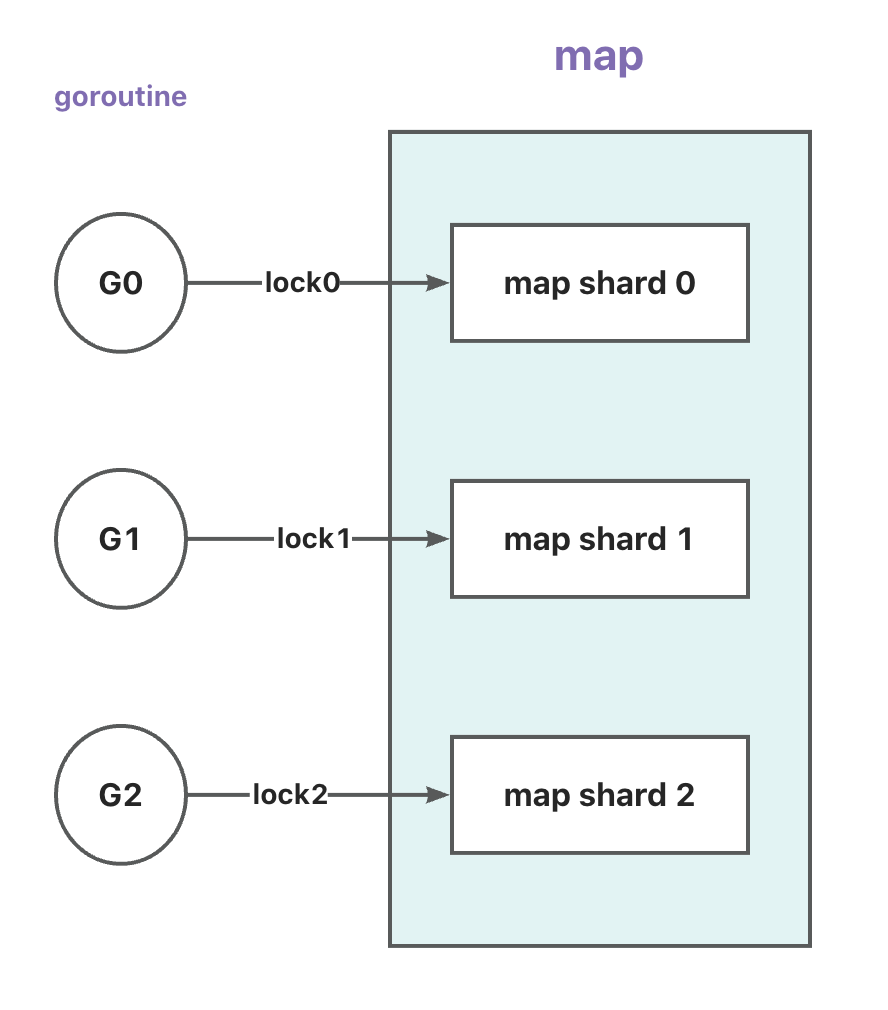
// A "thread" safe map of type string:Anything. // To avoid lock bottlenecks this map is dived to several (SHARD_COUNT) map shards. type ConcurrentMap[K comparable, V any] struct { shards []*ConcurrentMapShared[K, V] sharding func(key K)uint32 }
// A "thread" safe string to anything map. type ConcurrentMapShared[K comparable, V any] struct { items map[K]V sync.RWMutex // Read Write mutex, guards access to internal map. }
// GetShard returns shard under given key func(m ConcurrentMap[K, V]) GetShard(key K) *ConcurrentMapShared[K, V] { return m.shards[uint(m.sharding(key))%uint(SHARD_COUNT)] }